Port Streets Market Data
Newport Beach
Current Market Snapshot
Active Listings — 10
Median List Price — $9,460,000
Median Price per Sq Ft — $2,025
Median Days on Market — 29
Recent Sales (Last 90 Days)
Market Summary
Average Sale Price — $6,153,000
Average Home Size — 3,056
Average Price per Sq Ft — $1,955
Average Lot Size — 7,221
Recent Closings
1824 Port Tiffin
$3,950,000 | 1,838 sf
$2,149/ft | 0 DOM
2007 Port Chelsea
$4,300,000 | 1,850 sf
$1,850/ft | 0 DOM
2012 Port Chelsea
$5,200,000 | 2,571 sf
$2,022/ft | 17 DOM
1941 Port Chelsea
$9,200,000 | 4,345 sf
$2,117/ft | 8 DOM
1821 Port Barmouth
$4,470,000 | 2,485 sf
$1,798 | 15DOM
1870 Port Charles
$4,575,000 | 2,557 sf
$1,789/ft | 21 DOM
1938 Port Cardiff
$10,325,000 | 5270 sf
$1,959/ft | 0 DOM
Market Positioning
Original Homes
$3.5M – $4M+
Note: Updated original model sold for $4,470,000.
Remodeled / New Construction
$5M – $10M+
Market Notes
Tight inventory with strong buyer and builder demand
Pricing spread driven by condition: original vs. remodeled / new construction
Original-condition homes are pushing higher, reflecting strong entry-level demand
Demand remains consistent across the community, with some homes benefiting from stronger positioning and location
A snapshot of recent sales, pricing trends, and current market activity
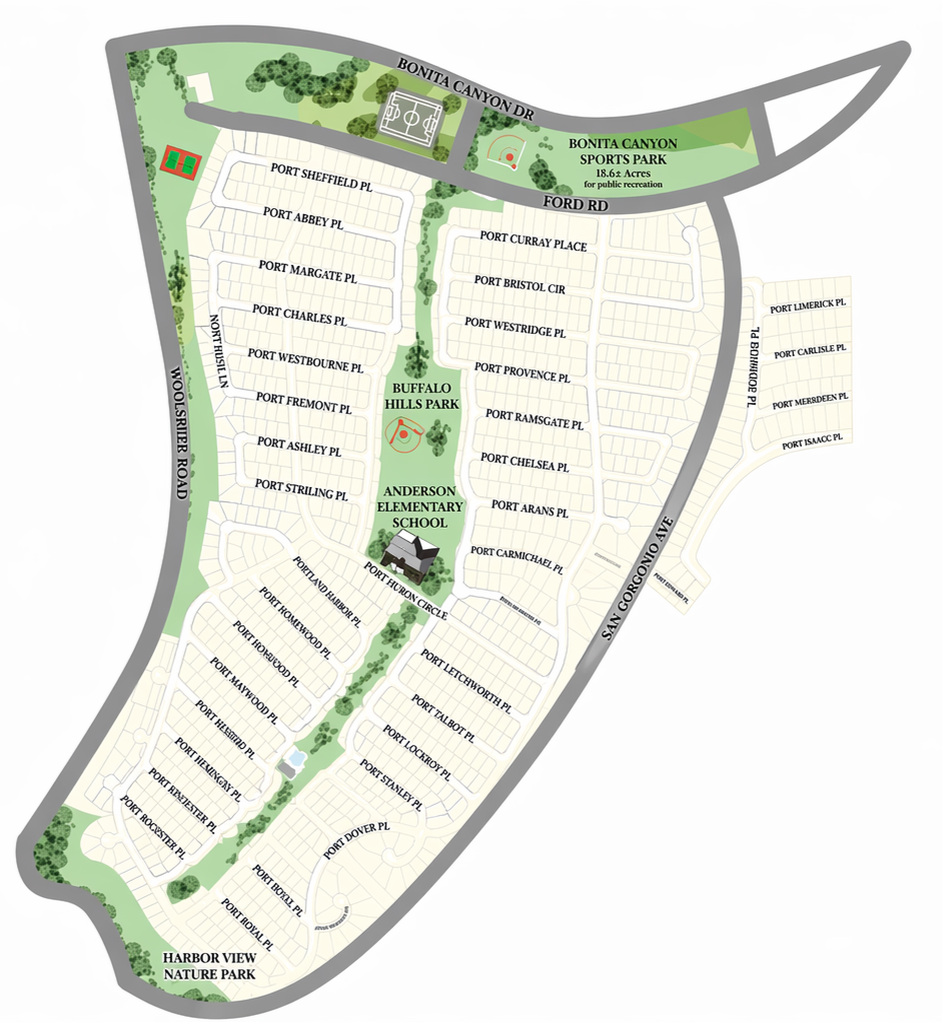
Port Streets Newport Beach Map
Last Updated: May 13th, 2026
David Roberts
Berkshire Hathaway
DRE #02052139
Data sourced from CRMLS and public records. Information deemed reliable but not guaranteed and subject to change.